Homes For Sale
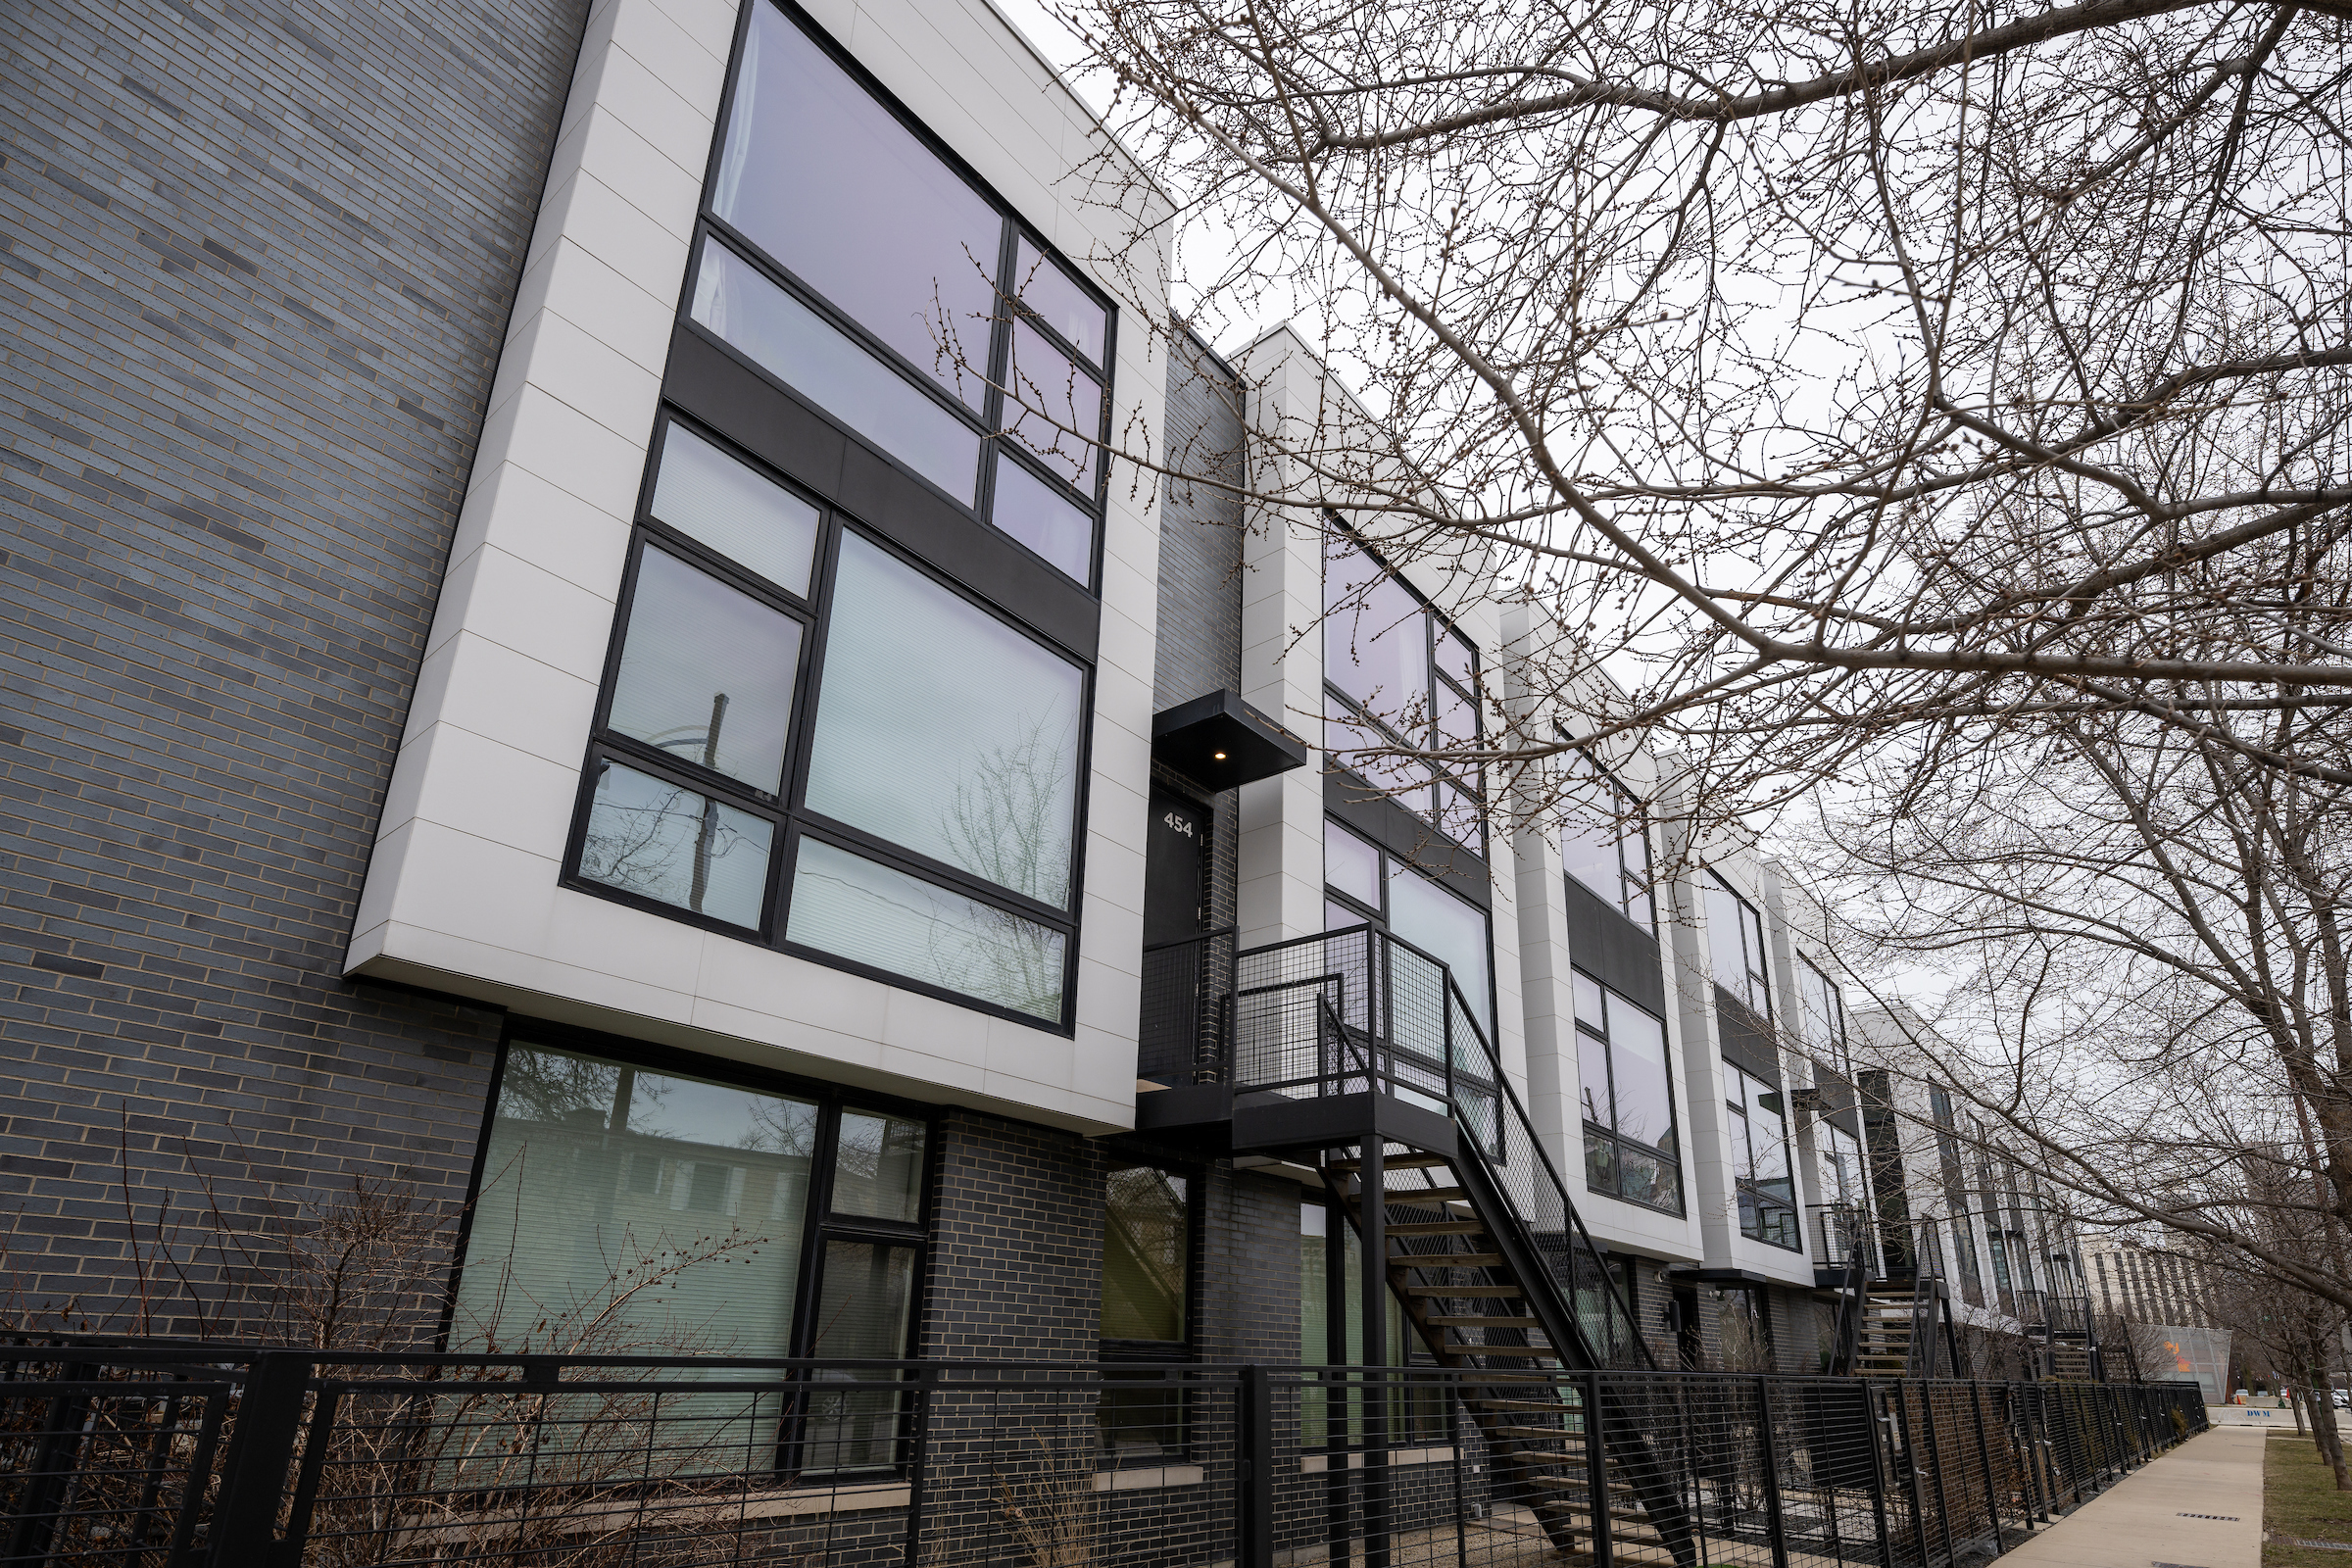
Basecamp Row Homes
Nestled in the Near North neighborhood, this family-centered home focuses on efficient living using high quality, environmentally-friendly materials. The unit features ample living space with ...
March 5, 2026
120% AMI 3 bedroom Condominium Near North
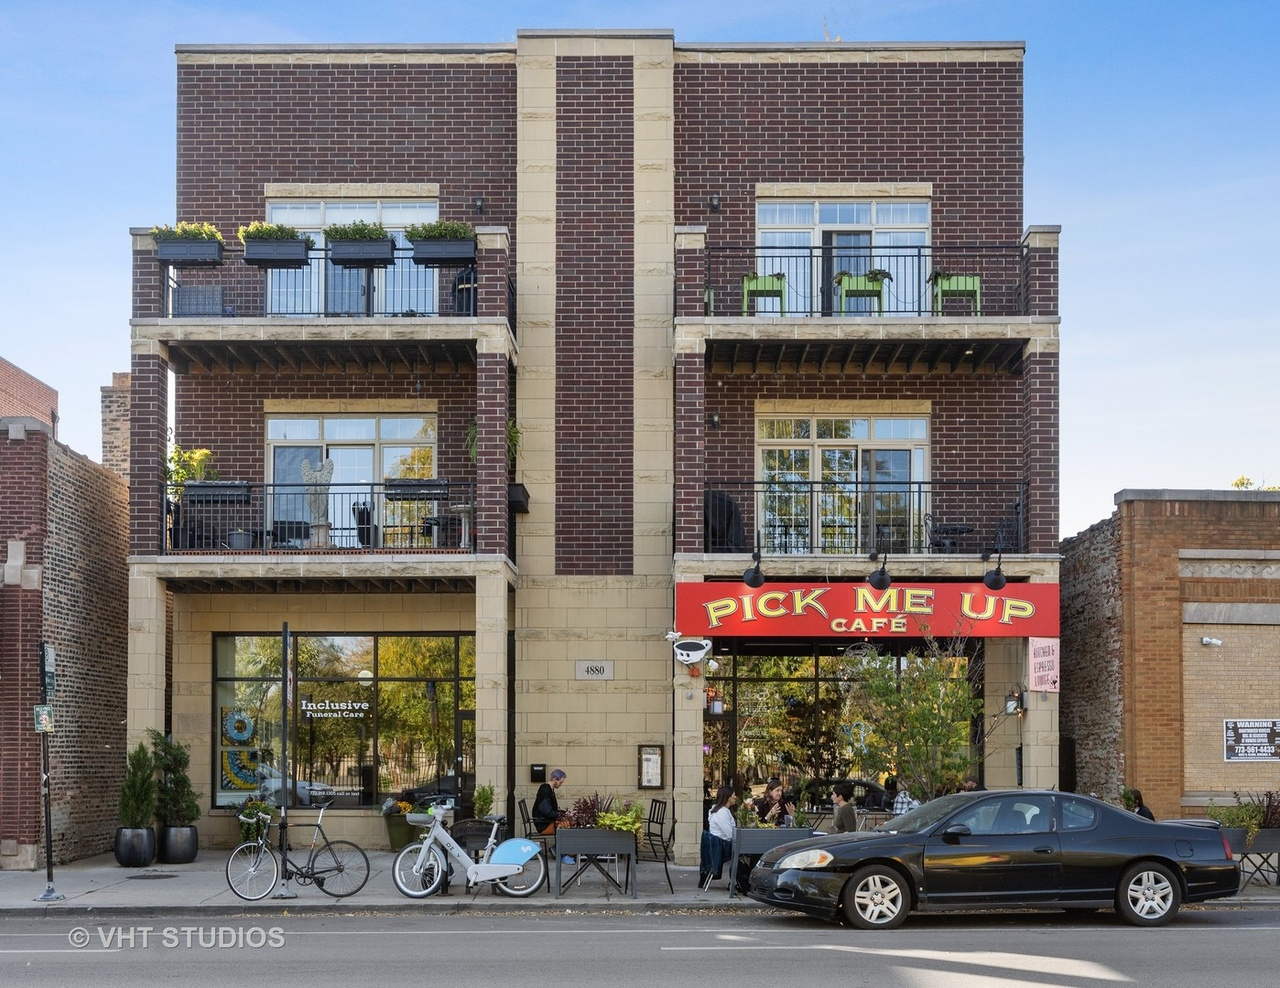
Uptown Condominium
4880 N Clark Unit 2A COMING SOON: Spacious and bright 2-bedroom, 2-bath home in mid-rise elevator building (wheelchair accessible from the attached garage) steps to ...
February 19, 2026
120% AMI 2 Bedrooms Condominium Ravenswood Uptown
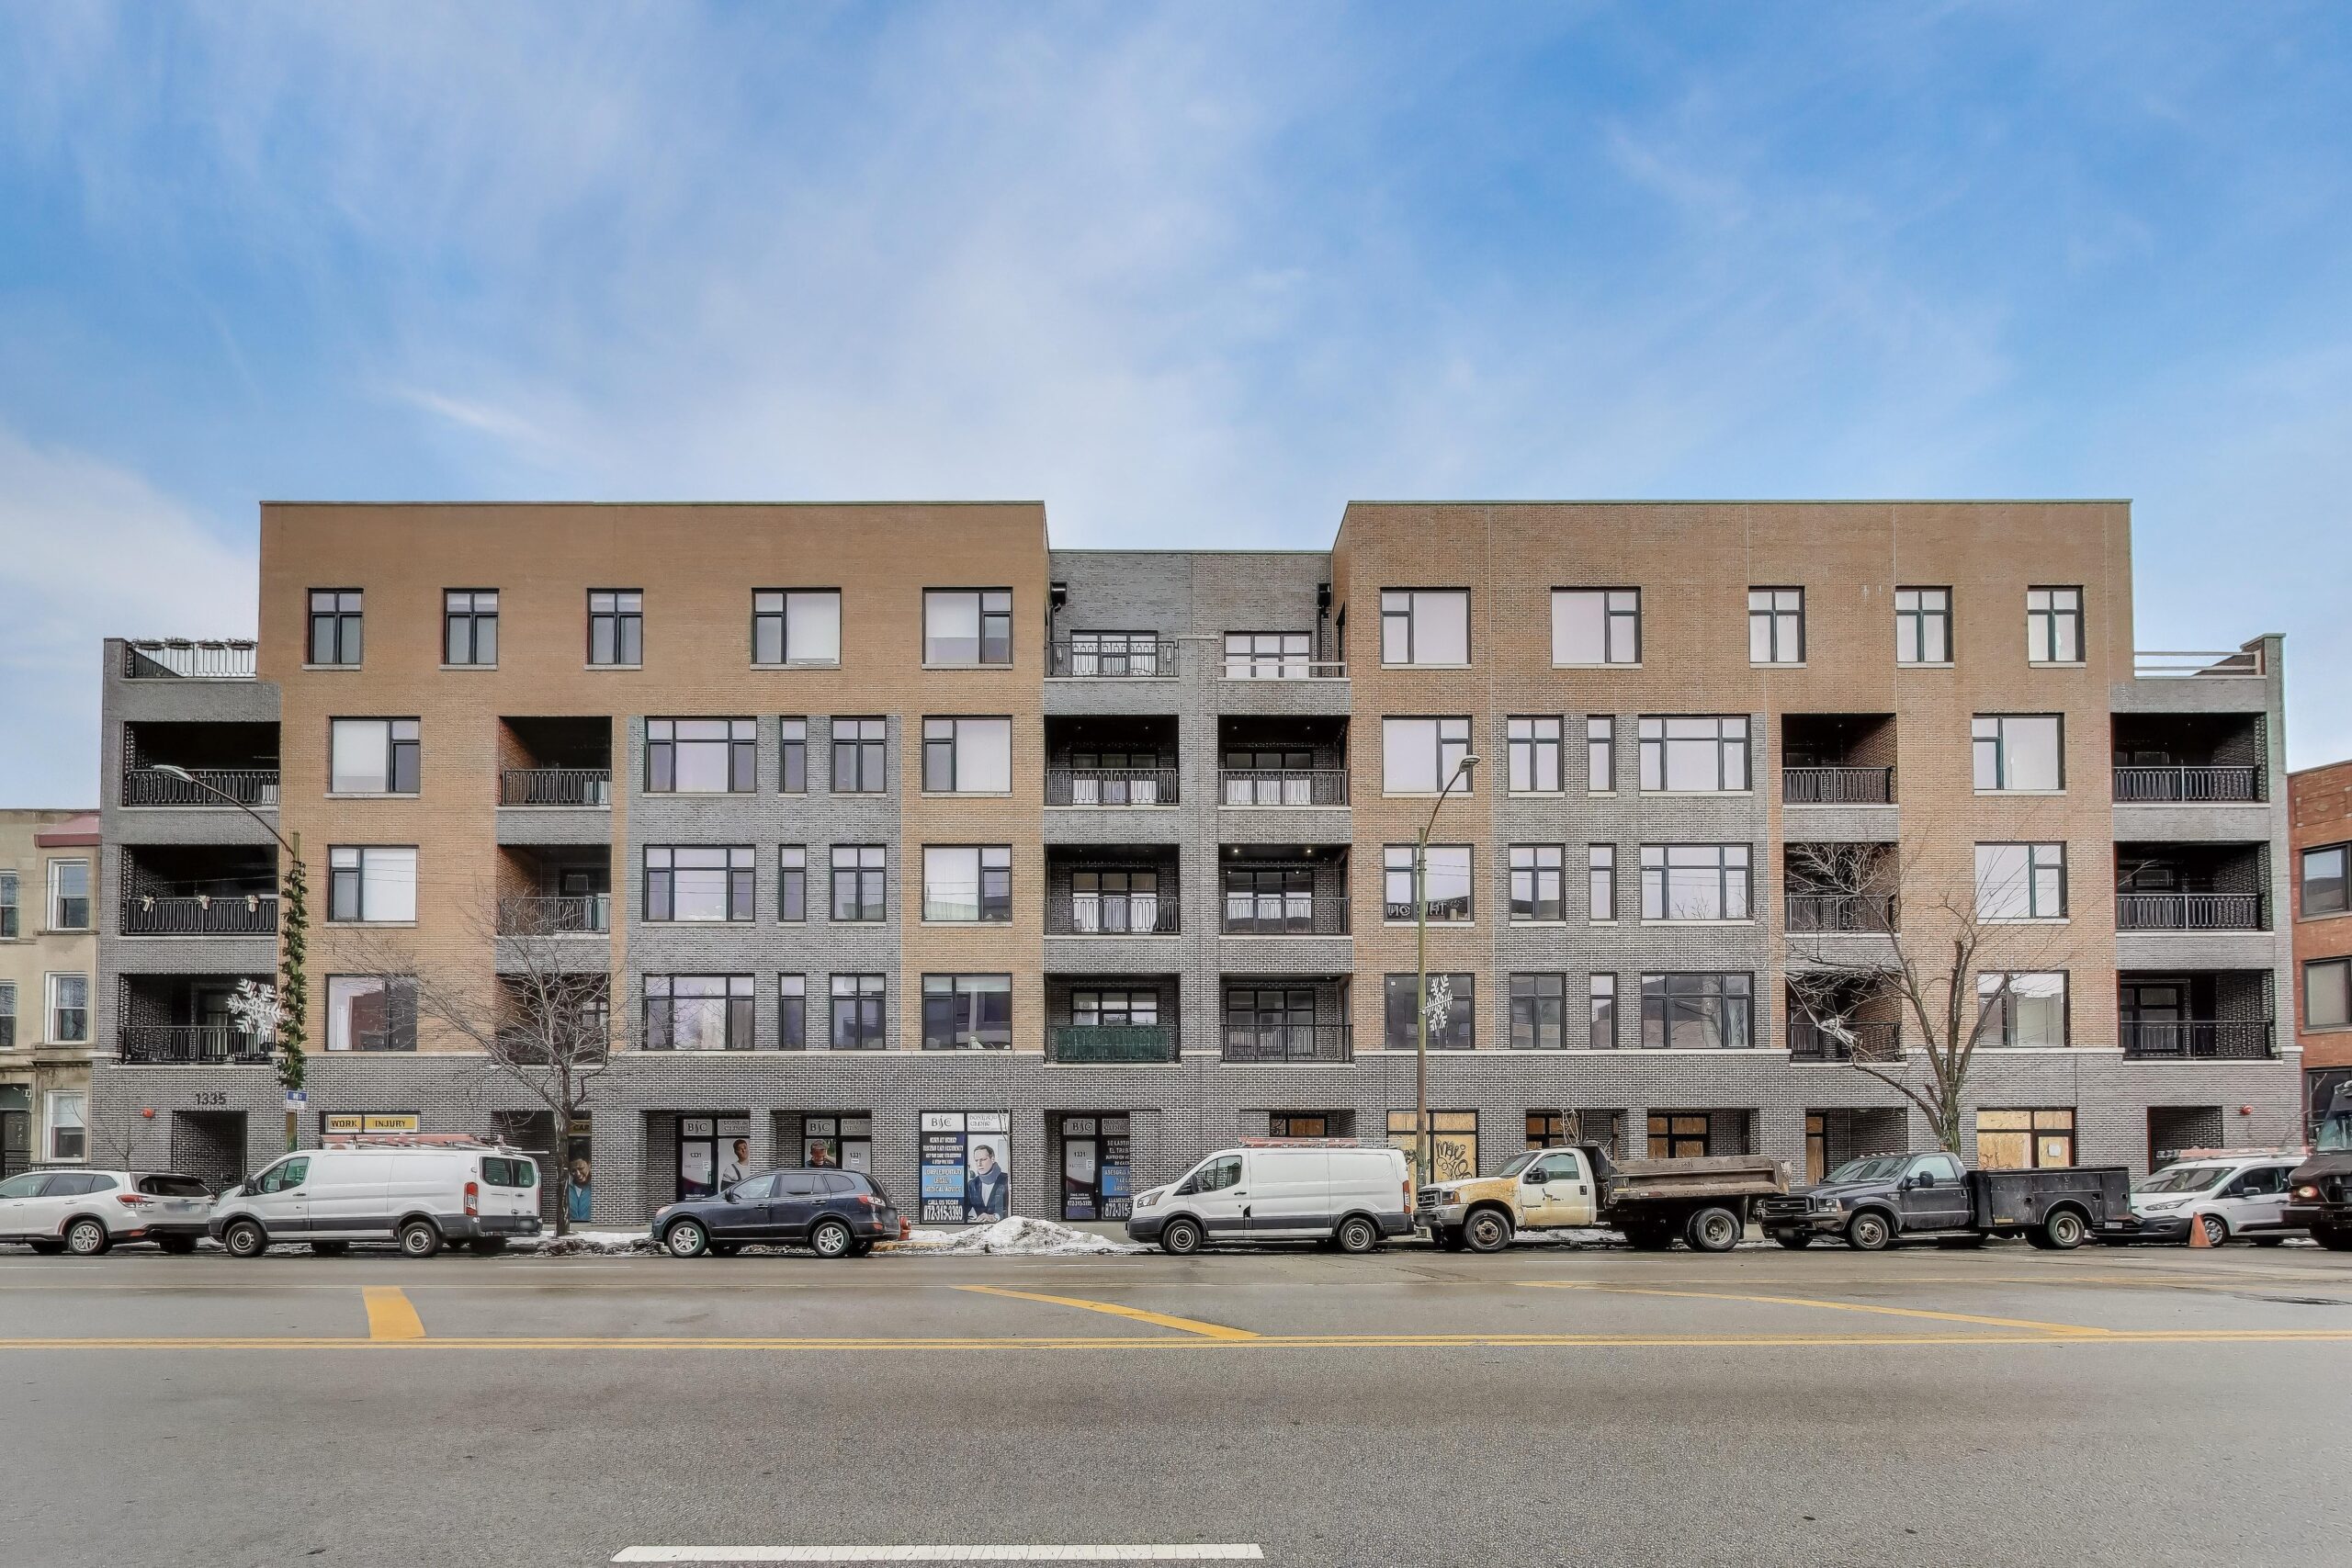
Wicker Park Condos
1317 N Western APPLICATIONS OPEN NOW THROUGH MARCH 20TH Introducing a New Construction Boutique Elevator Building in vibrant Wicker Park. Designer led with superior attention ...

Monroe Square Townhome
2537 W Monroe Unit B Step into this recently built, energy-efficient 3-bedroom home designed for modern living. The open-concept kitchen features sleek quartz countertops, stainless ...
August 5, 2025
3 bedroom East Garfield Park Townhome
Gross Annual Total Household Income Limits
| Household Size |
Maximum income to qualify to purchase units with income limit of 80% of AMI* |
Maximum income to qualify to purchase units with income limit of 100% of AMI* |
Maximum income to qualify to purchase units with income limit of 120% of AMI* |
Maximum income to qualify to purchase units with income limit of 140% of AMI* |
Maximum income to qualify to purchase units with income limit of 150% of AMI* |
|---|---|---|---|---|---|
| 1 Person | $67,150 | $84,000 | $100,800 | $117,600 | $126,000 |
| 2 Persons | $76,750 | $96,000 | $115,200 | 134,400 | $144,000 |
| 3 Persons | $86,350 | 108,000 | $129,600 | $151,200 | $162,000 |
| 4 Persons | $95,900 | $119,900 | $143,880 | $167,860 | $179,850 |
| 5 Persons | 103,600 | $129,500 | $155,400 | $181,300 | $194,250 |
| 6 Persons | $111,250 | $139,100 | $166,920 | $194,740 | 208,650 |
| 7 Persons | $118,950 | $148,700 | $178,440 | $208,180 | $223,050 |
| 8 Persons | $126,600 | $158,300 | $189,960 | $221,620 | $237,450 |
| 9 Persons | $134,400 | $167,900 | $201,480 | $235,060 | $251,850 |
| 10 Persons | $141,950 | $177,500 | $213,000 | $248,500 | $266,250 |
*AMI stands for Area Median Income which is the midpoint of a region’s income distribution, meaning that half of households in a region earn more than the median and half earn less than the median. The calculations used here are based on the AMI for the Chicago-Naperville-Joliet, IL HUD Metro FMR Area. HUD updates these figures once a year, typically in April, at which point we realign the AMI figures for our programs.